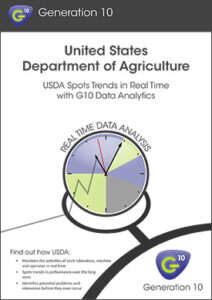
The US Department of Agriculture (USDA) develops and executes US federal government policy on farming, agriculture, forestry, and food. It is considered a gold standard in the cotton industry due to its exacting attention to detail and ability to work quickly and accurately with huge amounts of data.
The primary objective of USDA’s cotton grading and classing program is to facilitate interstate and foreign commerce by providing official quality determinations that aid in marketing. Its Agricultural Marketing Service (AMS) inspects, identifies and certifies that product quality is in accordance with official U.S. standards, establishing the quality of the current crop and of the annual carryover.
The Challenge:
Virtually every single one of the millions of cotton bales produced each year in the United States is classed in one of 10 regional USDA offices. To ensure consistency, USDA takes random “checklot” samples each day from all 10 locations for retesting. Although USDA’s classing offices were all using the same system, the amount of time it took to gather, track and analyse the vast amount of highly complex data limited the usefulness of the information and the way it could be utilised.
The Solution:
By implementing its G10 Framework and d3 Analytics, Generation 10 was able to gather all of the checklot data into a central location and give USDA analytical tools that provide insights into the performance of each individual machine, operator and laboratory in real time.
The Outcome:
The Generation 10 solution has enabled USDA not only to identify long-term trends in performance, but also to be proactive and address potential problems before they escalate — and in some cases before they even occur.
Now, USDA knows immediately if there are any problems in the performance of a laboratory, its equipment or its operators, and the ability to visualise data over a given time period helps to identify trends, better reference the actual data behind the graphs, and intervene before a problem develops.